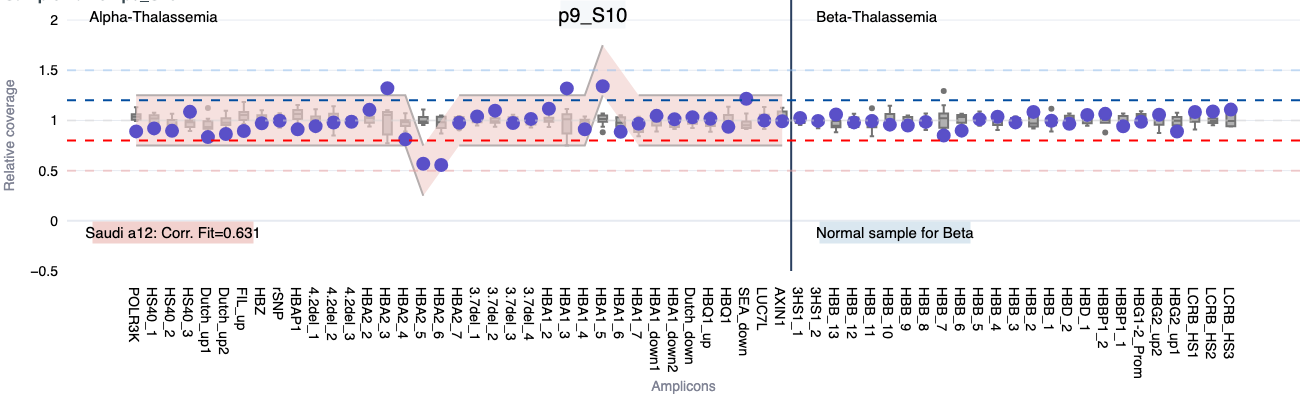
A CNV (Copy Number Variant) detection app designed during my first 2 years at Devyser AB. Here is a small portion of the app.
The app uses data generated by their internal software for Several types of genetically inherited deseases. It useses linear regression to find the correct mutation the patient has. It did a very good job finding the normal samples from the samples with problematic mutations. If a shade of red is shown in the graph that means that the sample has a mutation. If it is not shown the sample is normal. The bellow samples has a mutation called Saudi a12 with a 63% confidence.
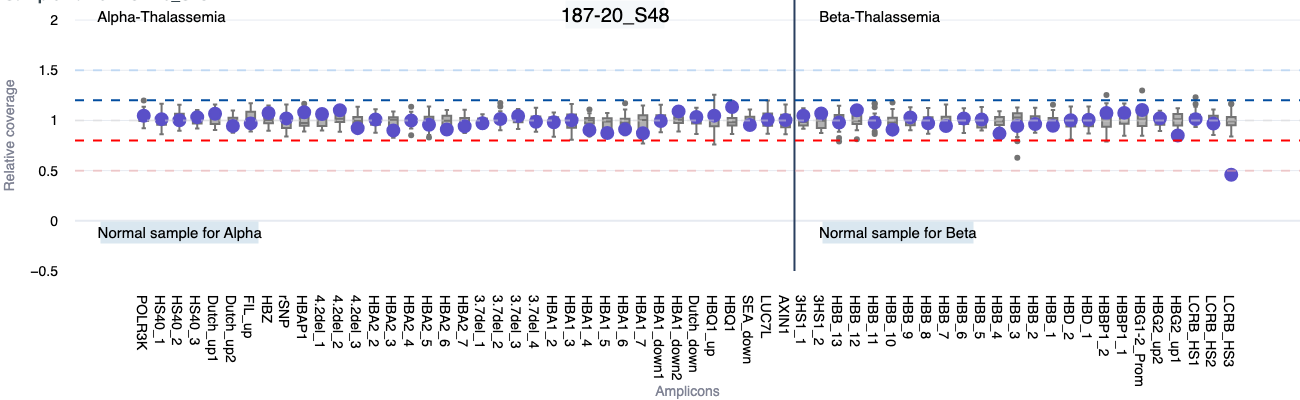
the bellow sample is normal
 Click here to use the interactive plot
An AI chat bot was intigrated in to the tool to check its potential to reduce the tech support cases.
Stack used:
Back-end: Python Front-end: Streamlit Data analysis: pandas Graphs and interative interface: Plotly
Ai integration: Pandas ai and olama
The interactive plot section of the CNV detection tool was latter inserted into the companies internal software portal.
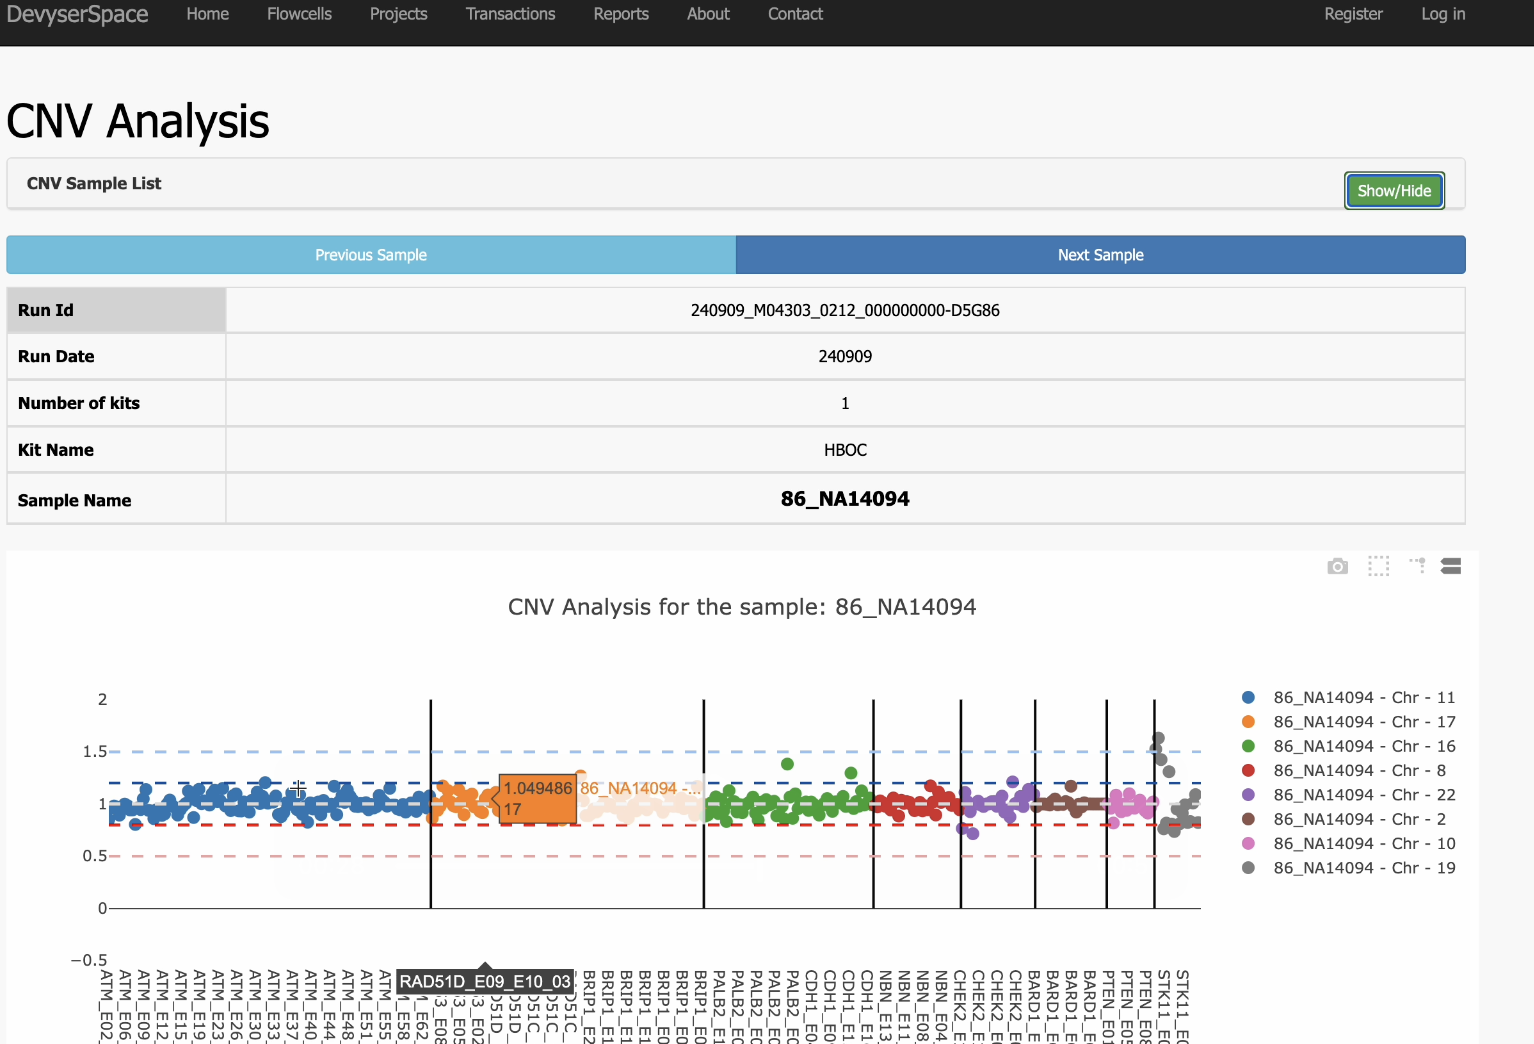
Stack used:
Back-end: C# Front-end: Html and Javascript (Plotly.js) Database: CouchDB
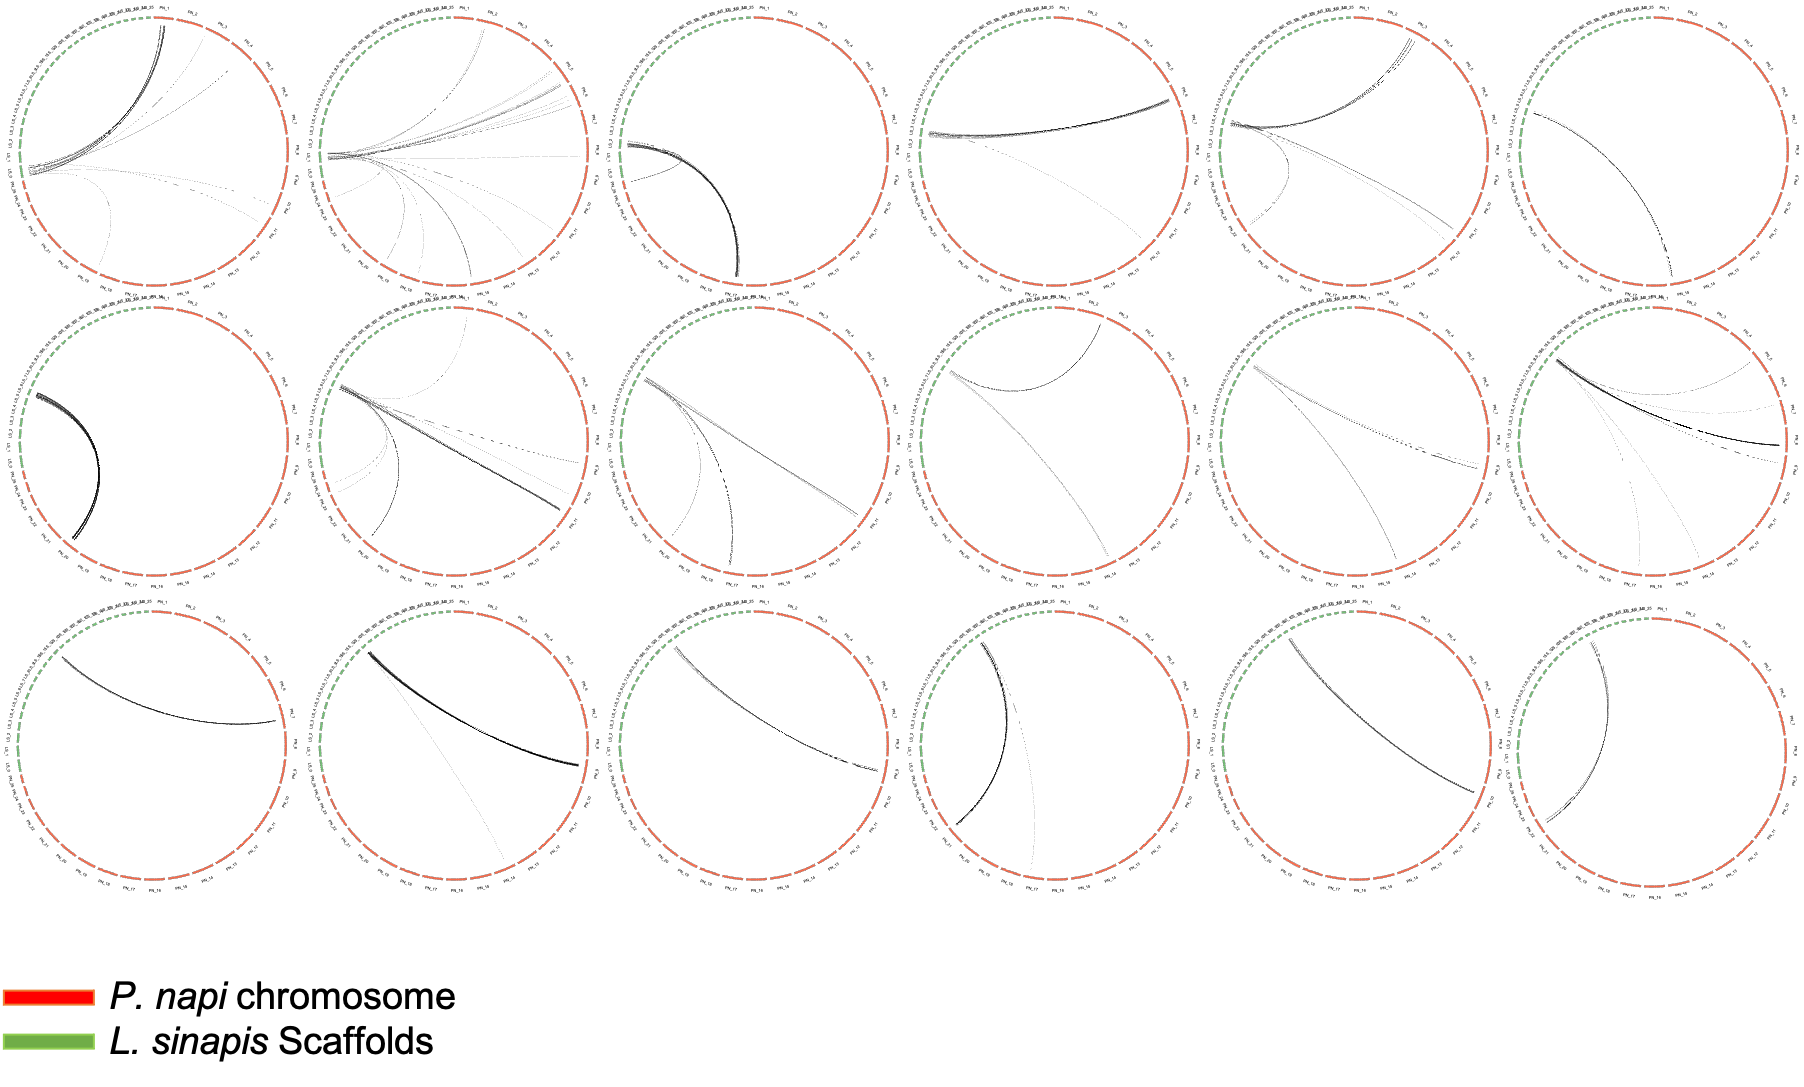
Phylogenetic relationship and divergence time estimates for 15 Lepidoptera species.
This was done during my PhD at Uppsala University for my first publication. We analysed the genome size changes in 15 butterfly species and mapped it on to the phylogenetic tree to show the per year increase in the genome size. The article can be found here.
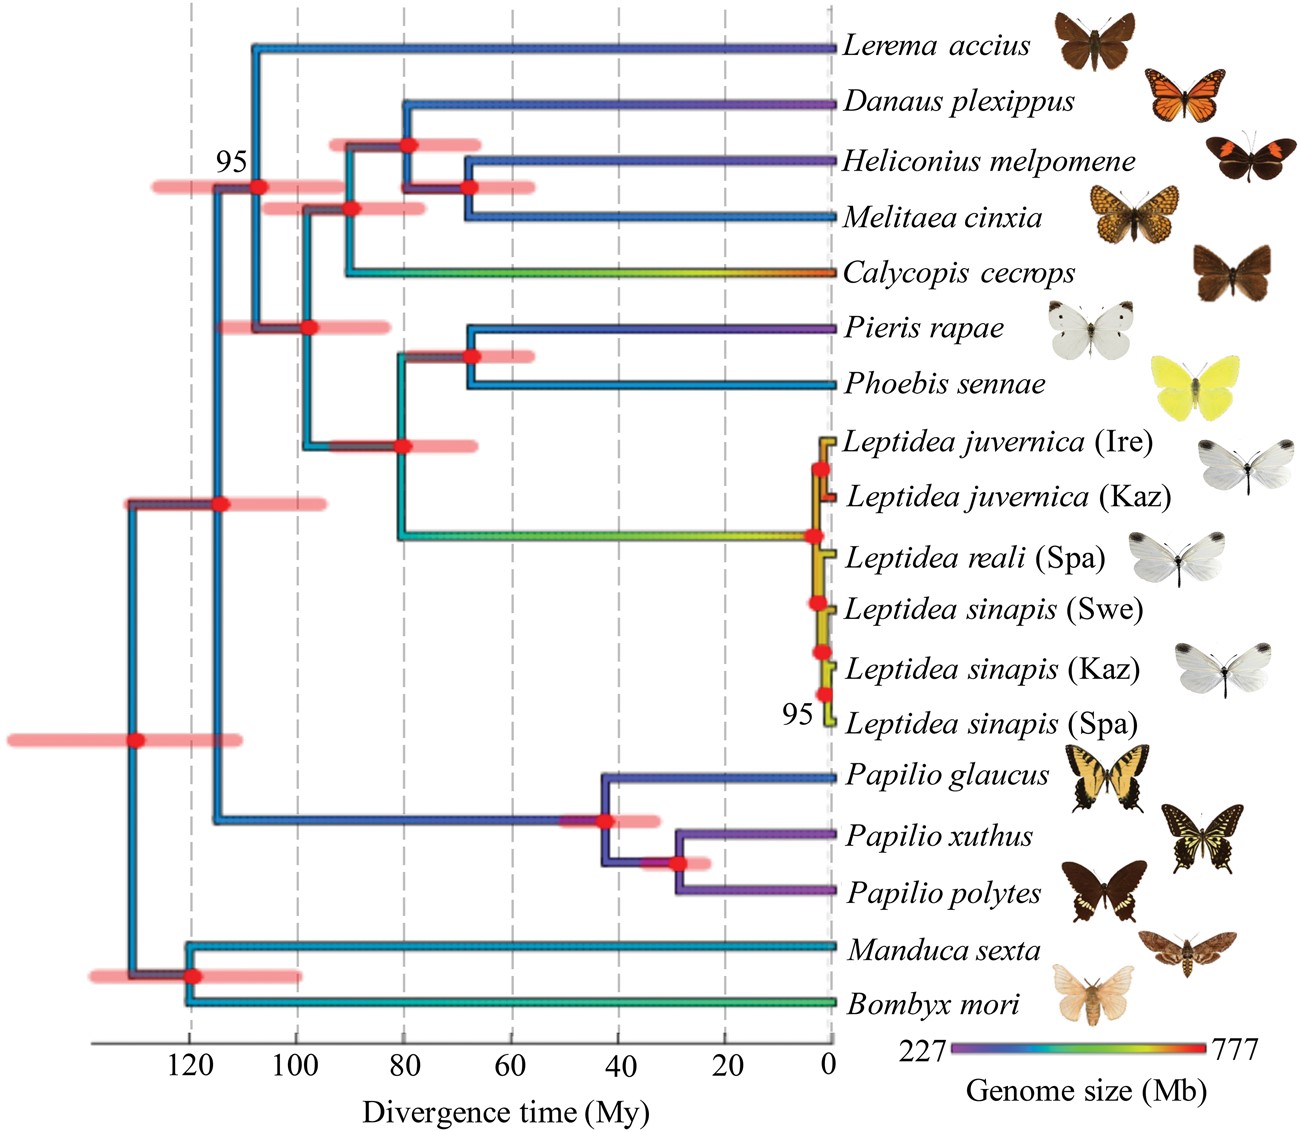
The analysis and the plotting was done using R
Joyplots using python
This is an infographic of the year wise numbers of Monarch butterflies collected in June and July. These two months were considered the peak seasons for monarch butterflies. This was done using the NABA (North American Butterfly Association) data.
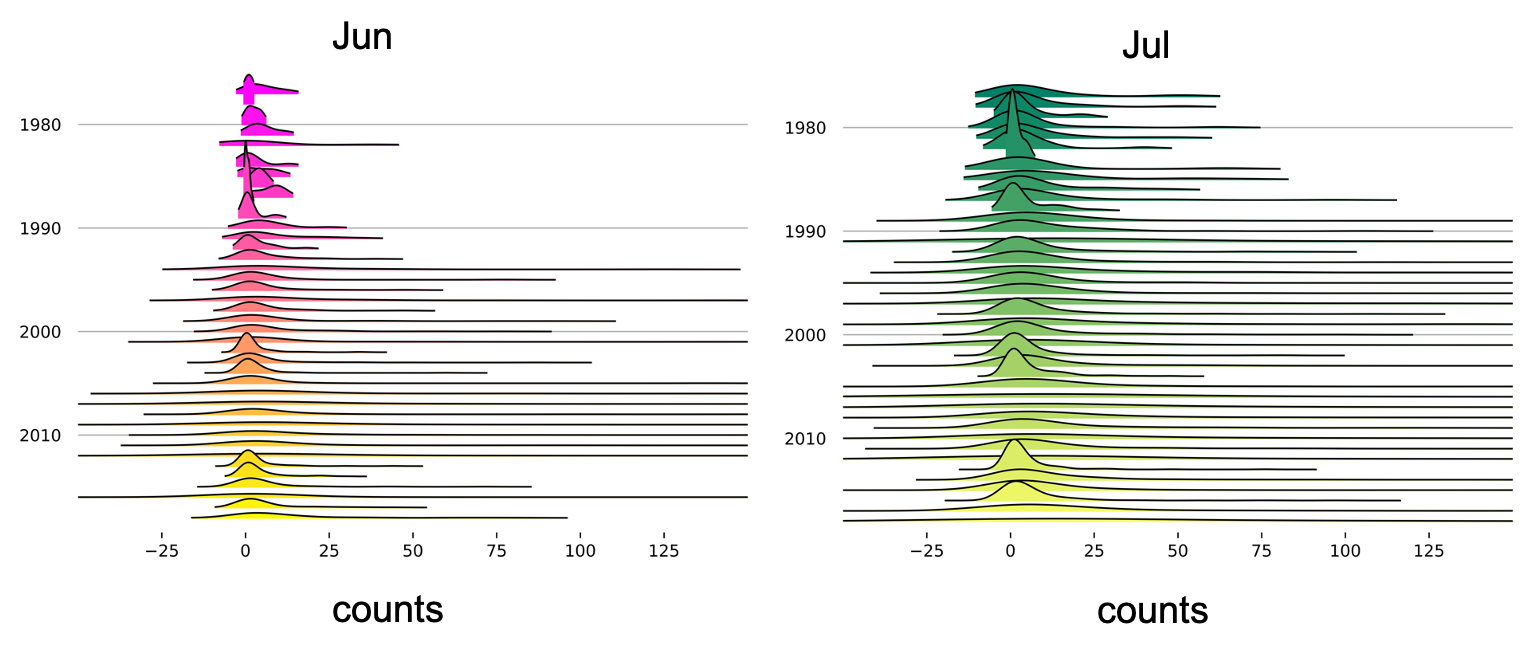
Stack used:
Data analysis: pandas Graphs: seaborn
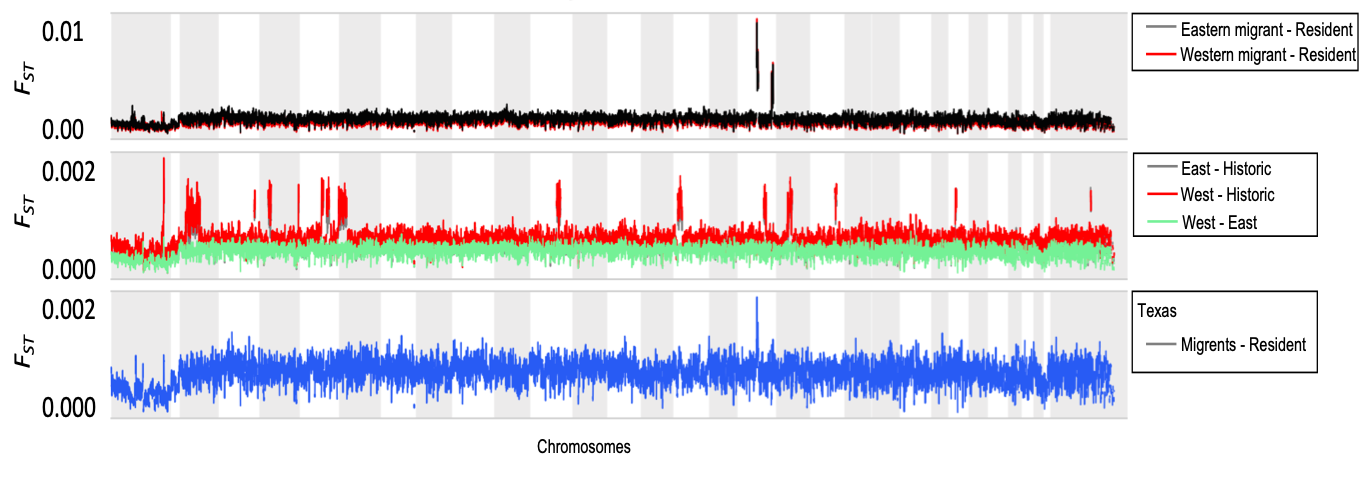
Violin plots using python
I think violin plots are best to show the clear difference in distribution. I think they work better than box plots for genomic datasets. Because it is theoretically expected that genetic differentiation (Fst) is higher on the Z-chromosome (Sex chromosomes) than in autosomes. A Consistent result was seen in both the below papers.
Click here to view the publication

Click here to view the publication
Genome scans

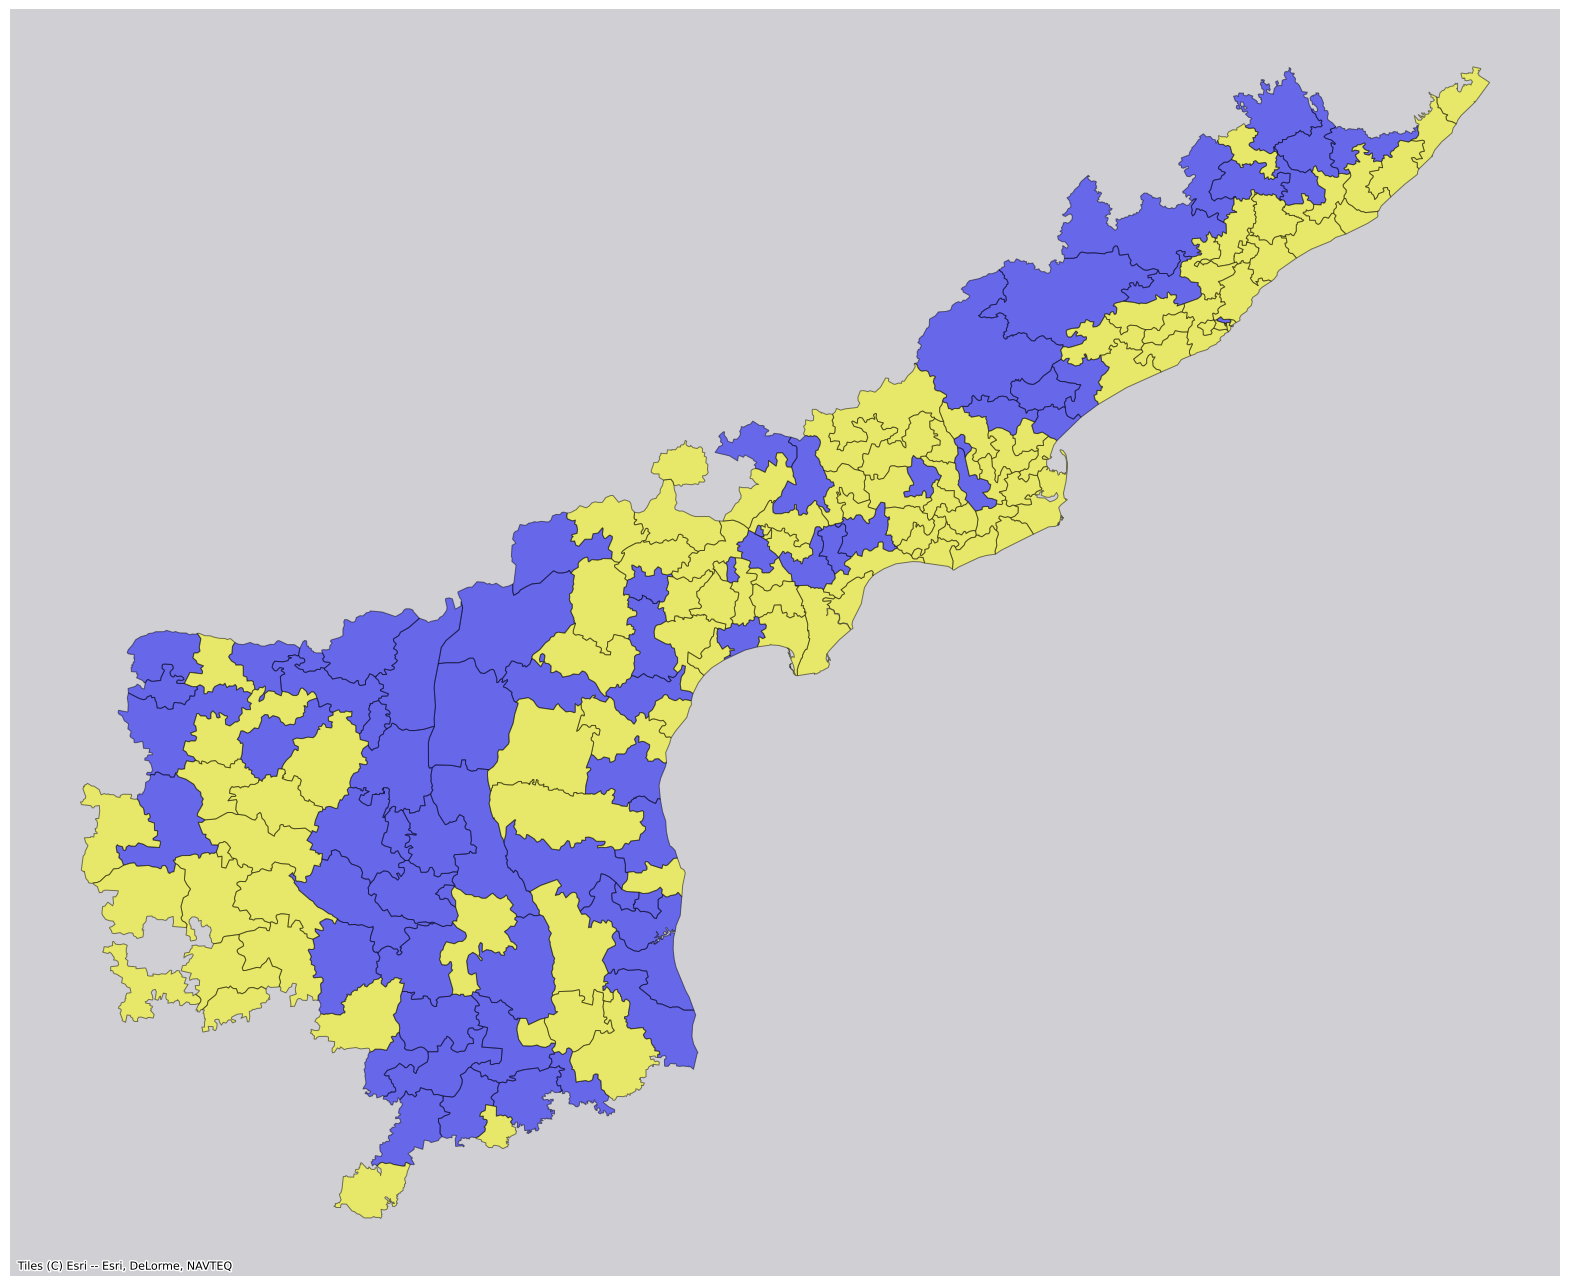
2024 Andhra Pradesh Legislative Assembly election analysis.
This was done purely for fun and curiosity. I tried to predict the election results in Andhra pradesh India during the 2024 elections using the poll data and the previous election data and totally failed in predicting the results. Here are some of the graphs.
Result for 2014 election
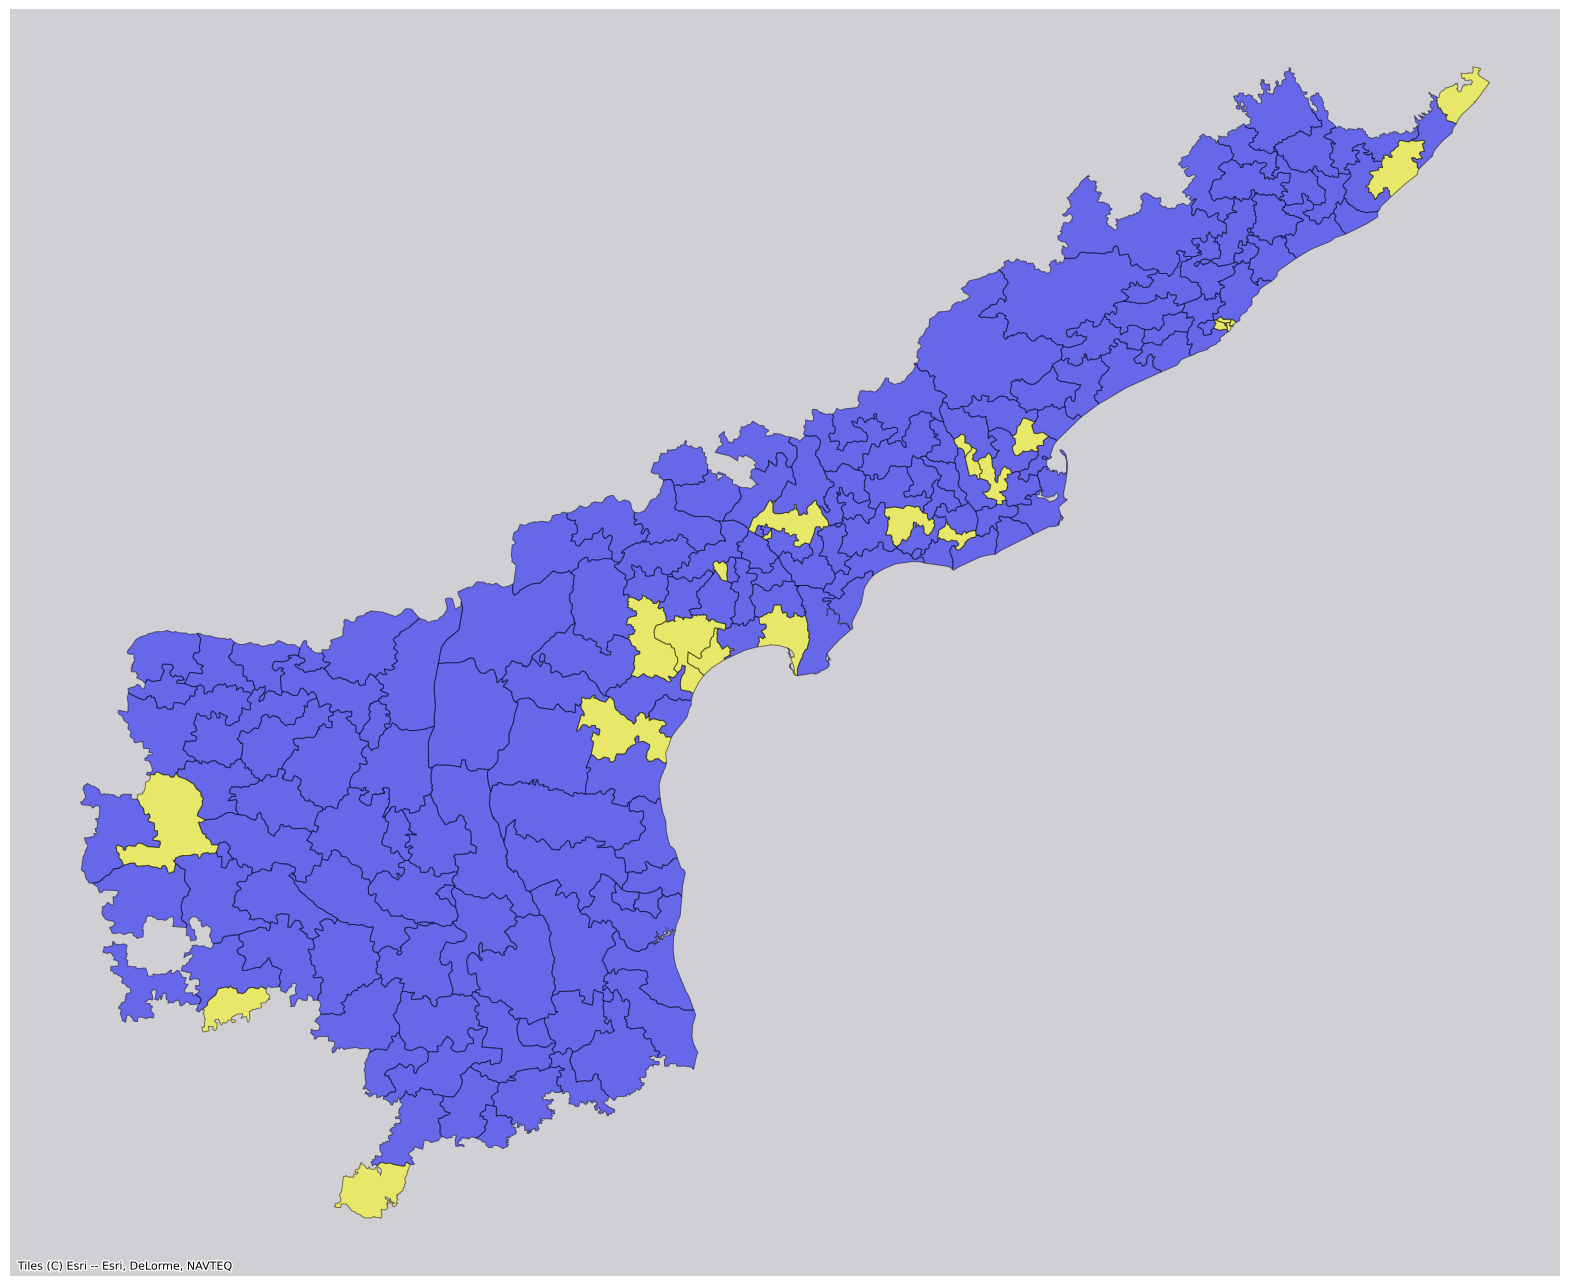
Result for 2019 election with alliances formed during the 2024 election.
An interactive prediction tool for the 2024 election
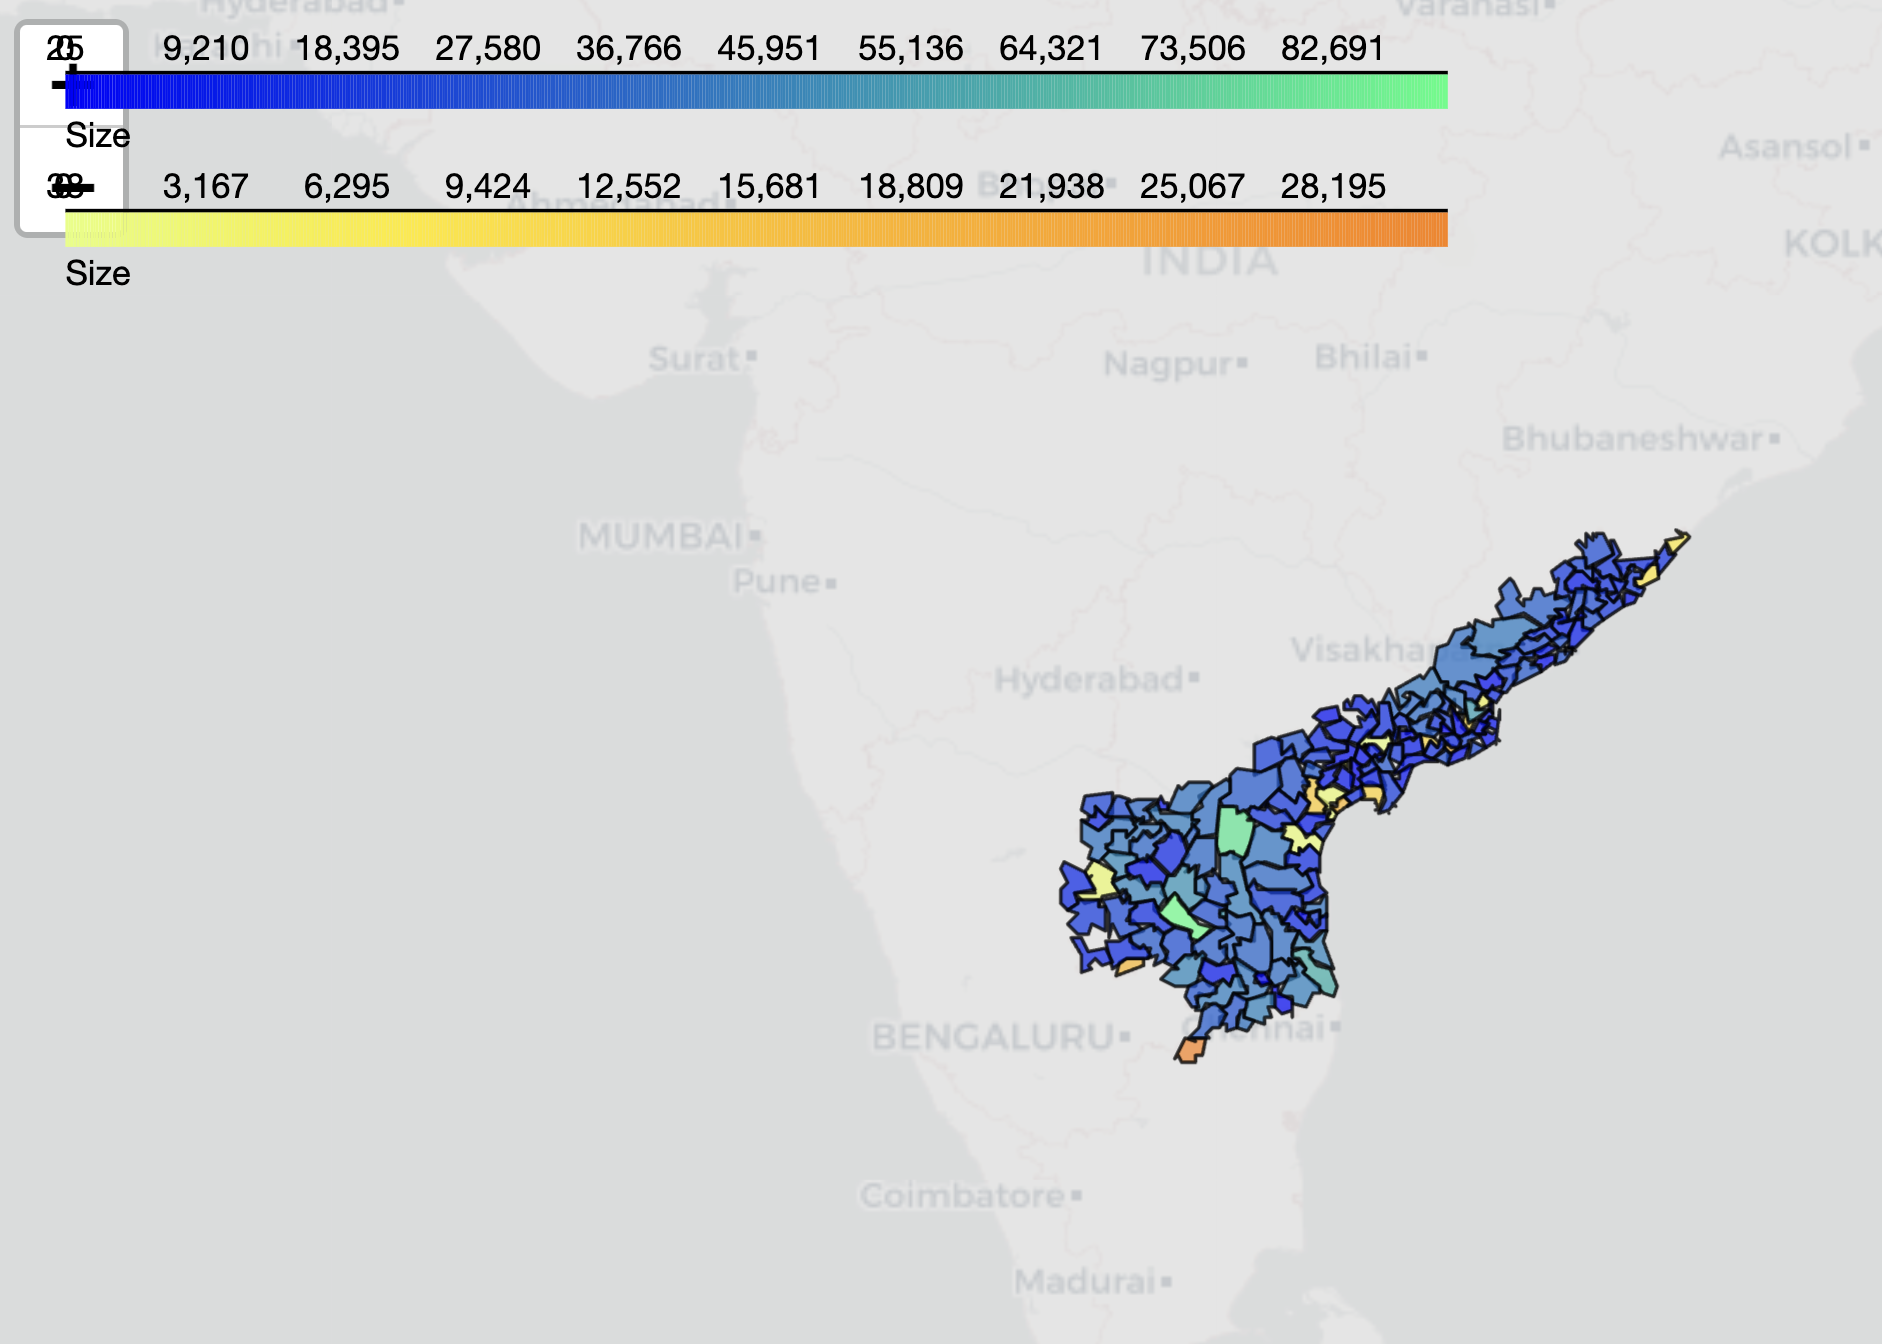
And I failed to predict the winner by a long shot. But I learnt a lot.
Circos plot